What is it
In the last unit, “Atomic Structure,” you learned about the photoelectric effect. Photoelectron spectroscopy uses the photoelectric effect to determine the electron configuration of an element.
Look back in “Atomic Structure” if you need a refresher on the photoelectric effect.
Scientists perform the photoelectric effect on a substance. They then measure the binding energy of each photoelectron (remember that binding energy is the energy required to remove an electron from an atom).
Data is collected to create a graph like the one below ↴

Determining Electron Configuration
We can use the graph produced from photoelectron spectroscopy to determine the electron configuration of the substance. From the electron configuration, we can determine the substance.
Look back at the example graph above. Notice that the x-axis is inverted. Normally, graphs start from zero on the left, and increase moving right. However, spectroscopy graphs start from a high value on the left and decrease moving right. This will be important later.
We will walk through an example to explain. Let’s say you are given the following photoelectron spectroscopy graph of a mystery element ↴

Electrons closer to the nucleus have a higher binding energy. So 1s has the highest binding energy. 2s has the second highest. 2p has the third highest, and so on.
Do not confuse binding energy with the energy level. Electrons in 1s possess the lowest energy, but require the most energy to be removed. Essentially, energy level and binding energy are inversely proportional.
As explained before, the highest binding energy is on the left side of the graph. Therefore, the peak representing the 1s subshell is the farthest to the left.
Every atom (except hydrogen), will have two electrons in the 1s subshell. Knowing this, we can use the 1s peak to determine the scaling of the y-axis.
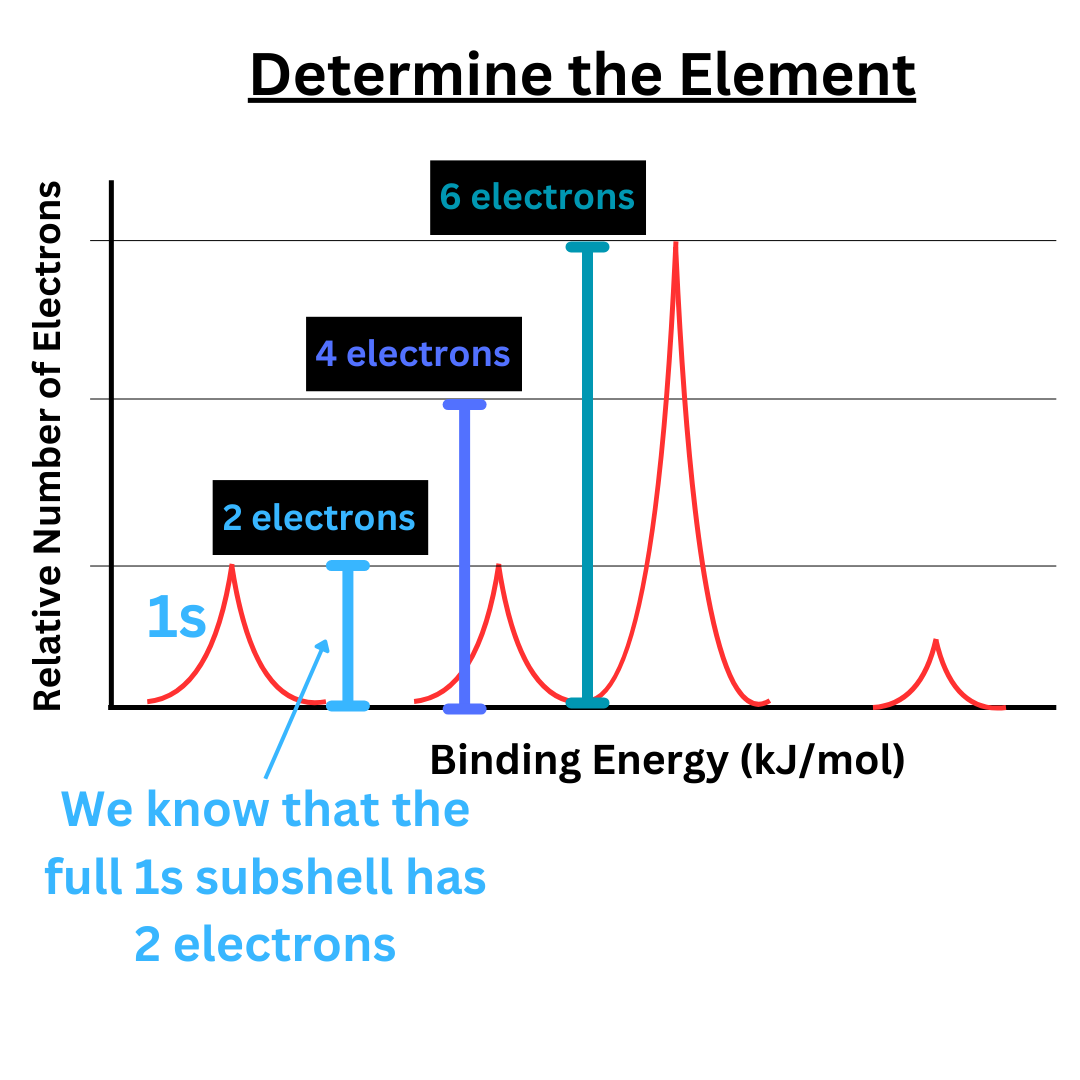
As we move to the right across the x-axis, binding energy decreases, but energy level increases. To the right of 1s is 2s. To the right of 2s is 2p. To the right of 2p is 3s, and so on. Follow the same order that you would for writing electron configuration. Now that we know the scaling of the y-axis, we can determine the number of electrons in each subshell.
Let’s use this to find the electron configuration of our example ↴
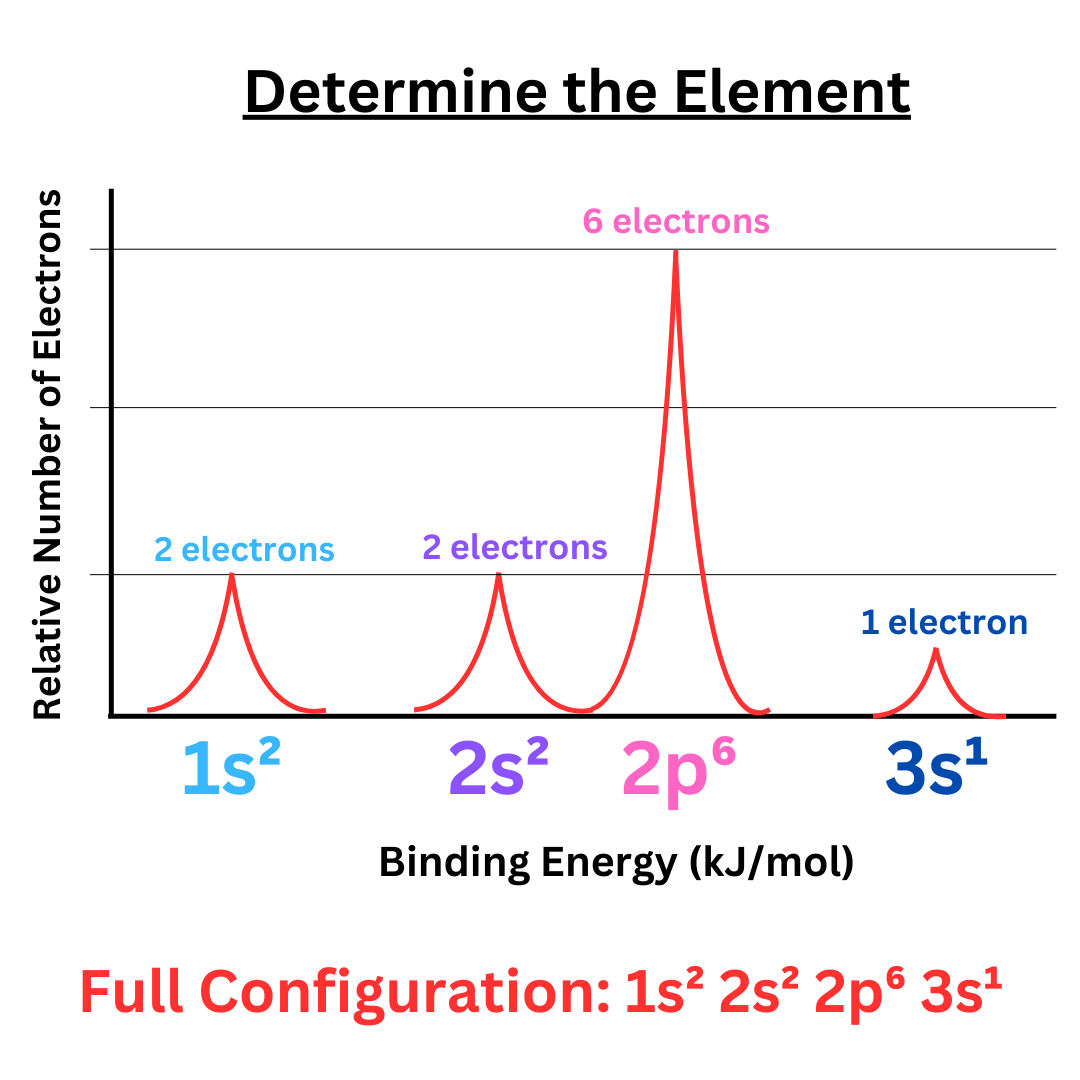
Our mystery element has an electron configuration of 1s² 2s² 2p⁶ 3s¹. The element with this configuration is sodium.
Comparing Spectroscopy Graphs
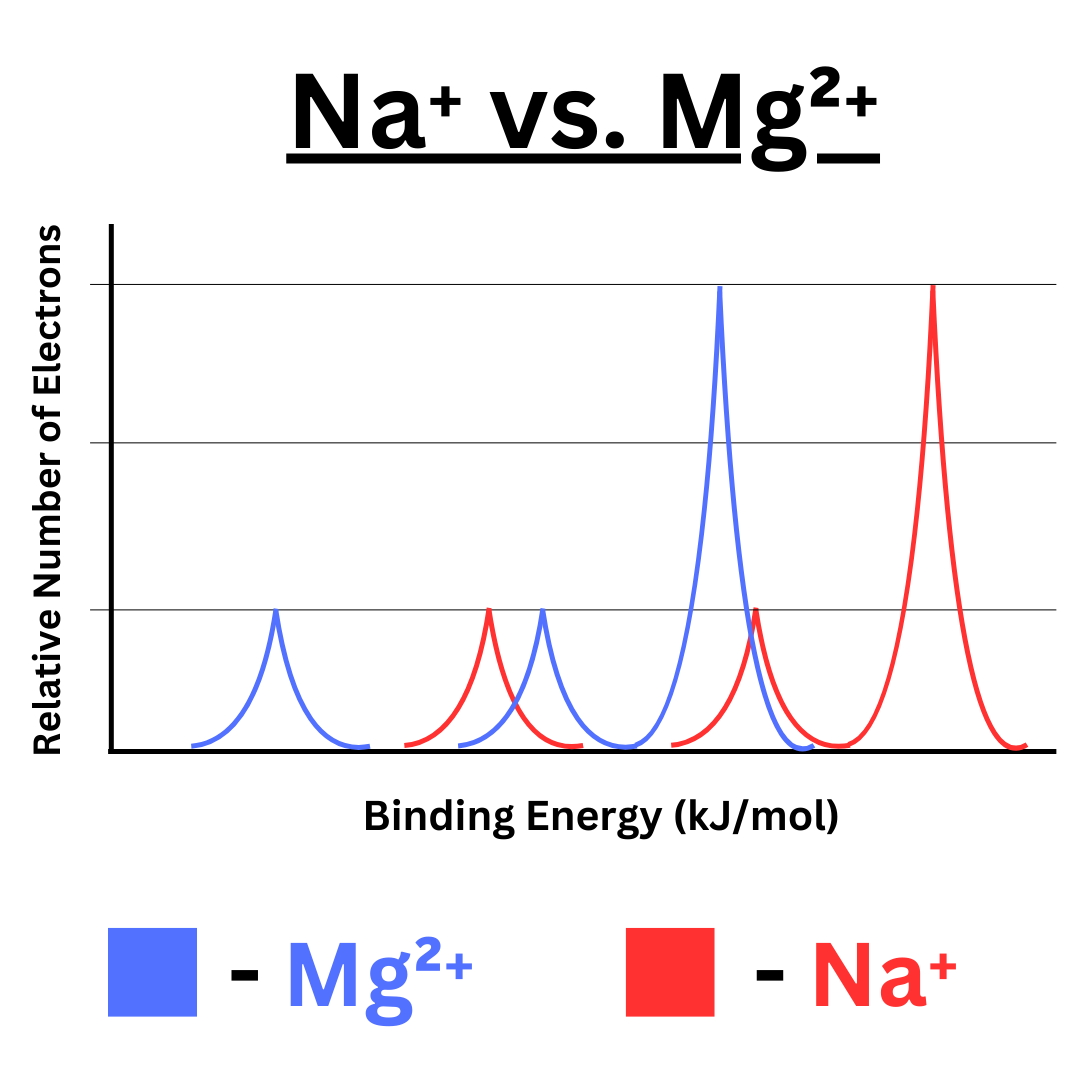
Imagine we did photoelectron spectroscopy on the Na⁺ and Mg²⁺ ions. These ions are isoelectronic (they both have 10 electrons). You might expect that their photoelectron spectroscopy graph would look the same. However, you’d be wrong.
Even though they have the same electron configuration (1s² 2s² 2p⁶), the binding energies are not the same. The reason that binding energy even exists is because of the force of attraction between electrons and protons. Magnesium has more protons than sodium, so it will pull on its electrons more. Consequently, magnesium has higher binding energy values. The magnesium graph will have the same shape as sodium, but it will be shifted to the left due to higher binding energy.
Here’s a comparison ↴